
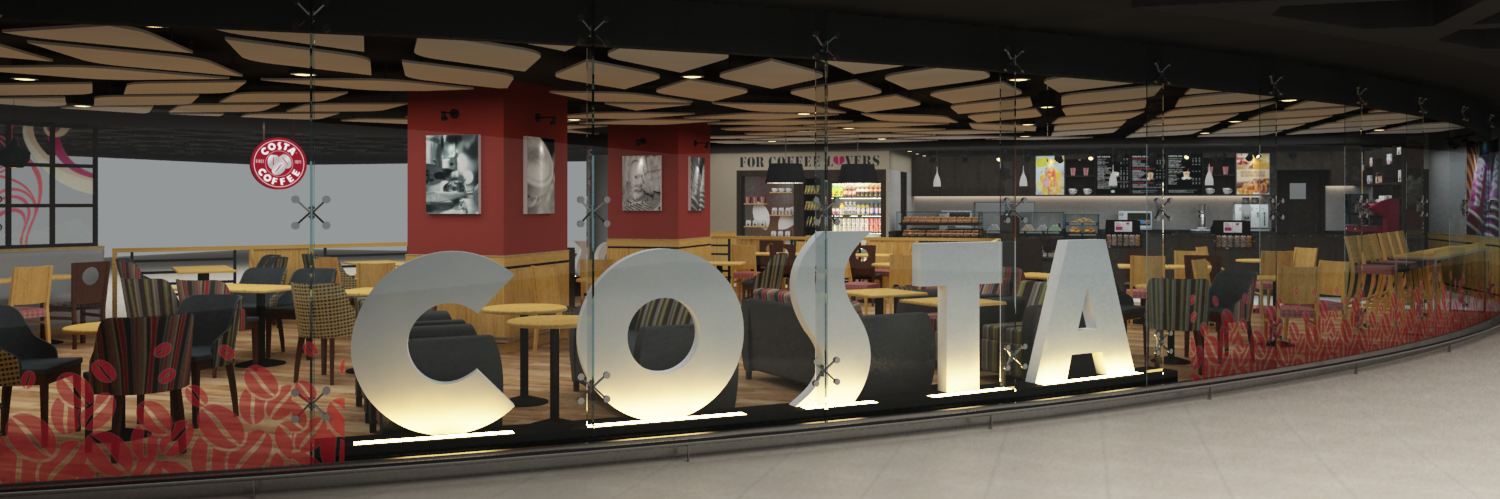
Costa Coffee, founded in 1971 in London, is the UK’s largest coffee chain with a global presence in over 4,000 locations. In 2019, it was acquired by The Coca-Cola Company, becoming a key part of its global beverage portfolio. Since the acquisition, Costa has accelerated its digital transformation, focusing on scalable franchise solutions and data-driven platforms like the MyCosta portal and Costa Data Exchange.

Background
Costa Coffee, the UK’s leading coffeehouse chain with a global presence, is part of The Coca-Cola Company, following its acquisition in 2019.
To support its growing franchise network and data-driven operations, Costa launched strategic digital initiatives to streamline internal reporting and enable seamless data exchange with franchisees.
Project Snapshot
Role:
Lead Product Designer
Tools Used:
Figma, SharePoint, Power BI, Adobe Suite
Scope:
- Rationalising over 50+ internal reports
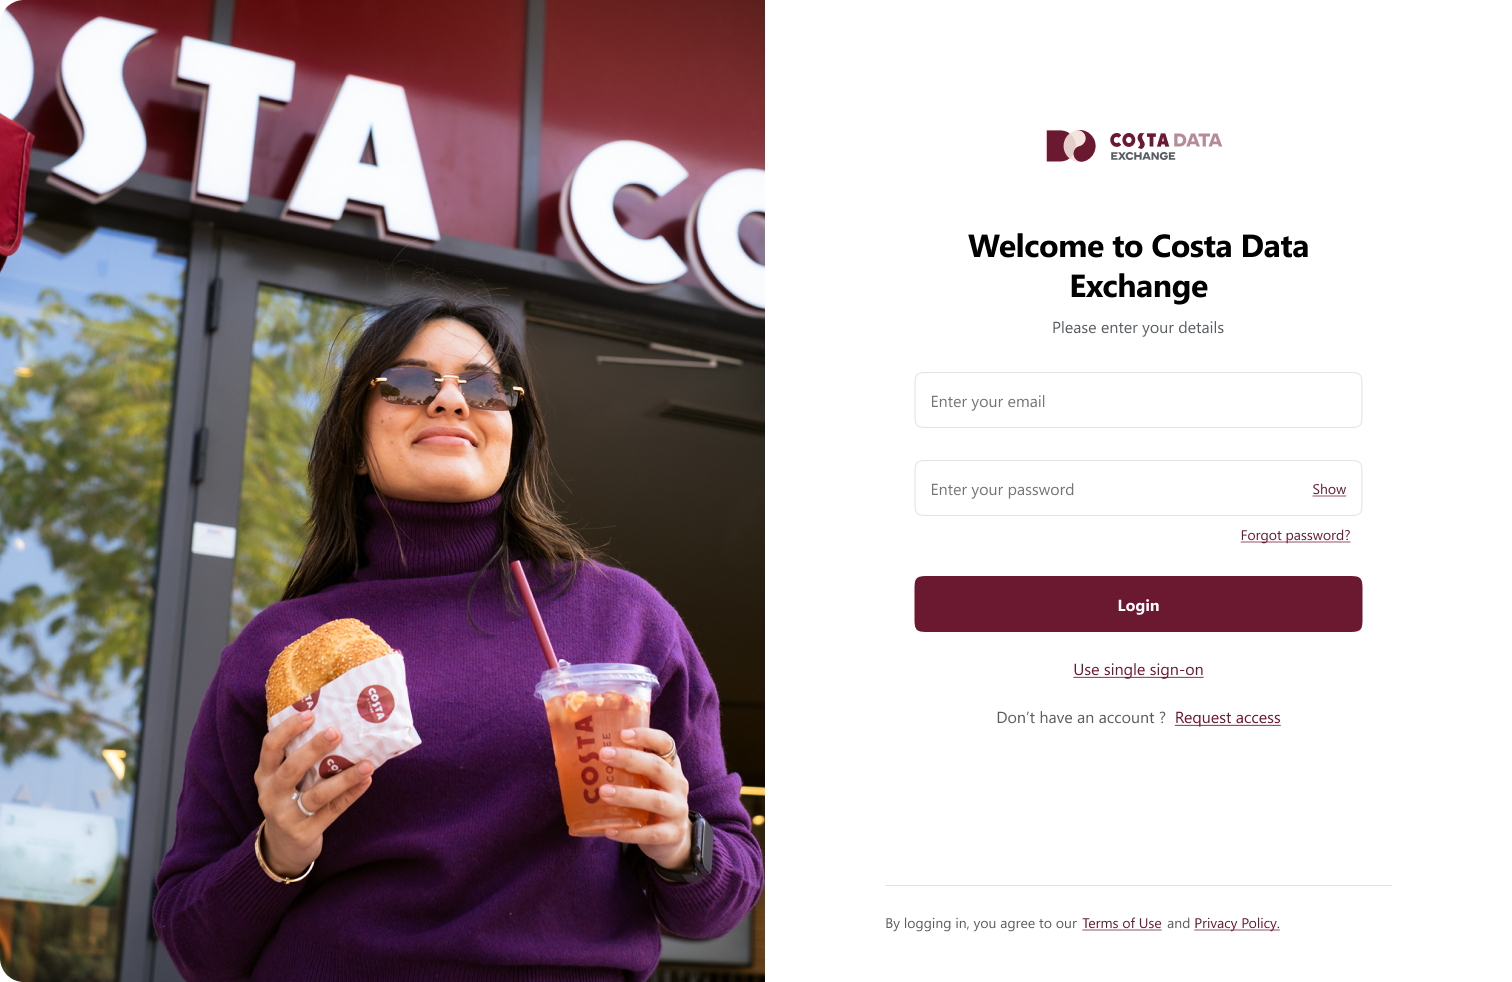
- Designing the Costa Data Exchange Platform
- Improving UX for franchisees & business analysts
- Aligning with the future vision of the MyCosta portal
Lead Product Designer
Tools Used:
Figma, SharePoint, Power BI, Adobe Suite
Scope:
- Rationalising over 50+ internal reports
- Designing the Costa Data Exchange Platform
- Improving UX for franchisees & business analysts
- Aligning with the future vision of the MyCosta portal
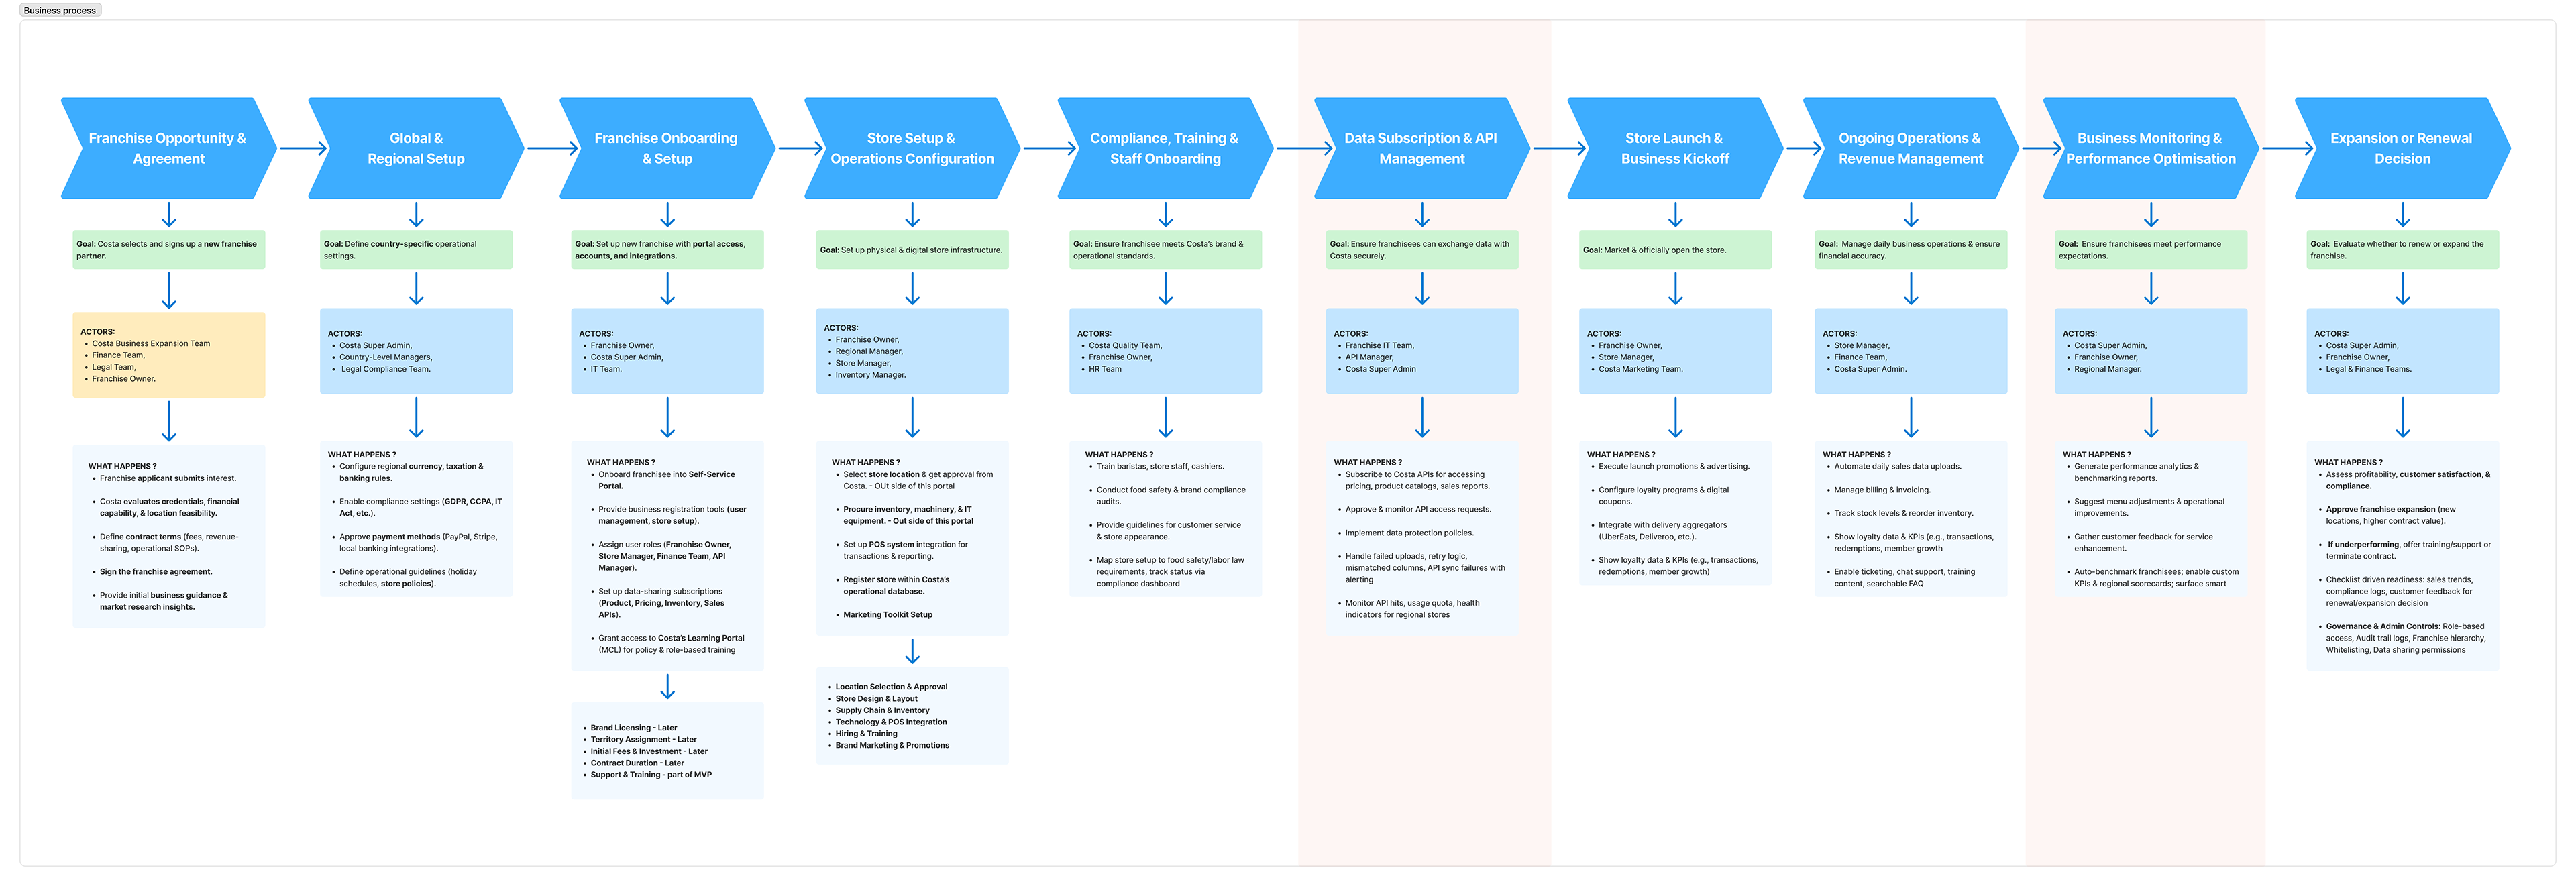
Challenge
Franchisees struggled to submit required sales and operational data accurately and on time. Internally, teams used 120+ reports, many outdated or redundant, resulting in inconsistent decision-making.
Costa Coffee operates a large franchise network globally. Their internal reporting tools and franchisee data submission processes were:
- Highly fragmented across formats (Excel, SAP, SharePoint, Power BI)
- Cumbersome for non-technical users to manage
- Lacking a consistent interface or unified system
- Siloed and duplicative, leading to confusion and inefficiency
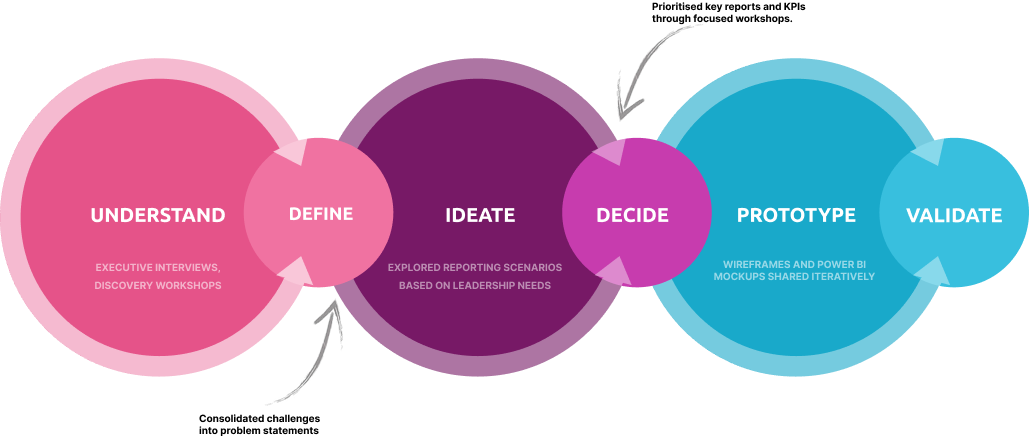
Framing the Problem with
Design Thinking
Design Thinking
Understanding the Leaders
Behind the Need
To deliver real value through report rationalisation, I have engaged directly with Costa Coffee’s executive leadership team. Each leader brought a unique perspective, grounded in their strategic responsibilities. By mapping their functional needs and decision-making rhythms, we ensured the final solution was tailored, relevant, and actionable across the board.


Discovery &Research
Stakeholder Interviews
Met with 15+ stakeholders, including franchise owners, ops managers, data analysts, and the Costa digital team. Key insights:
- Power users needed flexible reporting.
- Franchisees required simplicity and guidance.
- Report naming and grouping lacked logic and clarity.
Stakeholder Interviews
Met with 15+ stakeholders, including franchise owners, ops managers, data analysts, and the Costa digital team. Key insights:
- Power users needed flexible reporting.
- Franchisees required simplicity and guidance.
- Report naming and grouping lacked logic and clarity.
Heuristic Audit
- Reviewed over 120 reports — ~30% were redundant.
- Identified common KPIS across departments.
- UX inconsistencies in how reports were accessed and filtered.
- Reviewed over 120 reports — ~30% were redundant.
- Identified common KPIS across departments.
- UX inconsistencies in how reports were accessed and filtered.
Personas Created
- Franchise Owner: Non-technical, submits data weekly
- Ops Manager: Needs tracking and compliance visibility
- HQ Analyst: Uses reports to guide business decisions
- Franchise Owner: Non-technical, submits data weekly
- Ops Manager: Needs tracking and compliance visibility
- HQ Analyst: Uses reports to guide business decisions
https://www.figma.com/proto/1AMKwTe1XQZWdHv7gSkF1s/MVP-wireframes?page-id=1741%3A3257&node-id=1741-4688&viewport=562%2C338%2C0.06&t=iu8cshQ6EzZhyOOm-1&scaling=min-zoom&content-scaling=fixed&starting-point-node-id=1741%3A4688&show-proto-sidebar=1
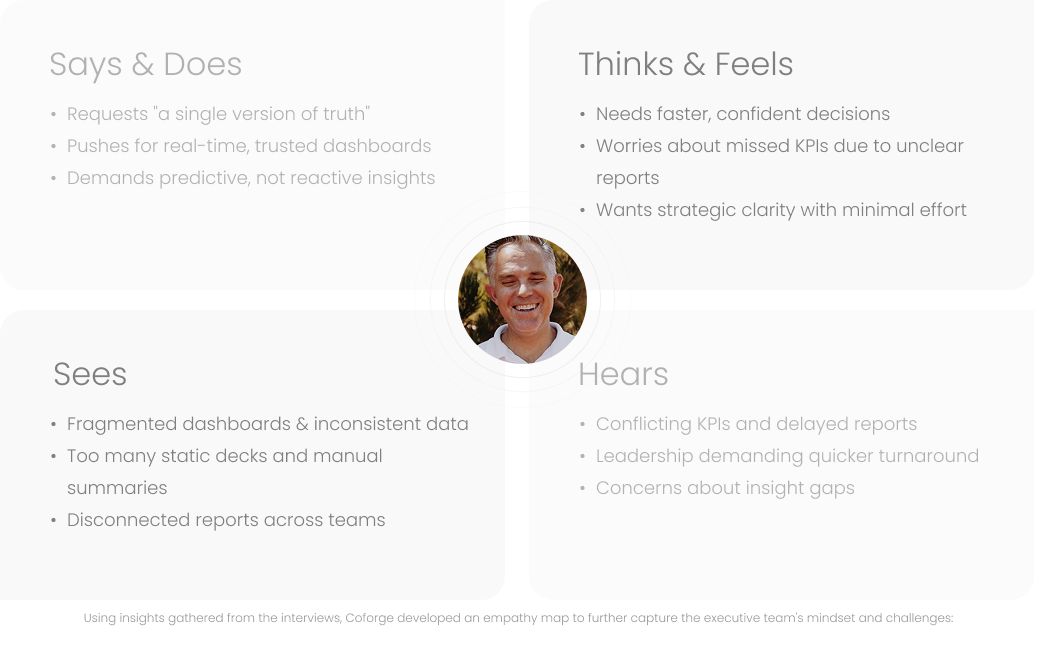
Executive
Empathy Map
Empathy Map
Strategy &
Approach
Approach
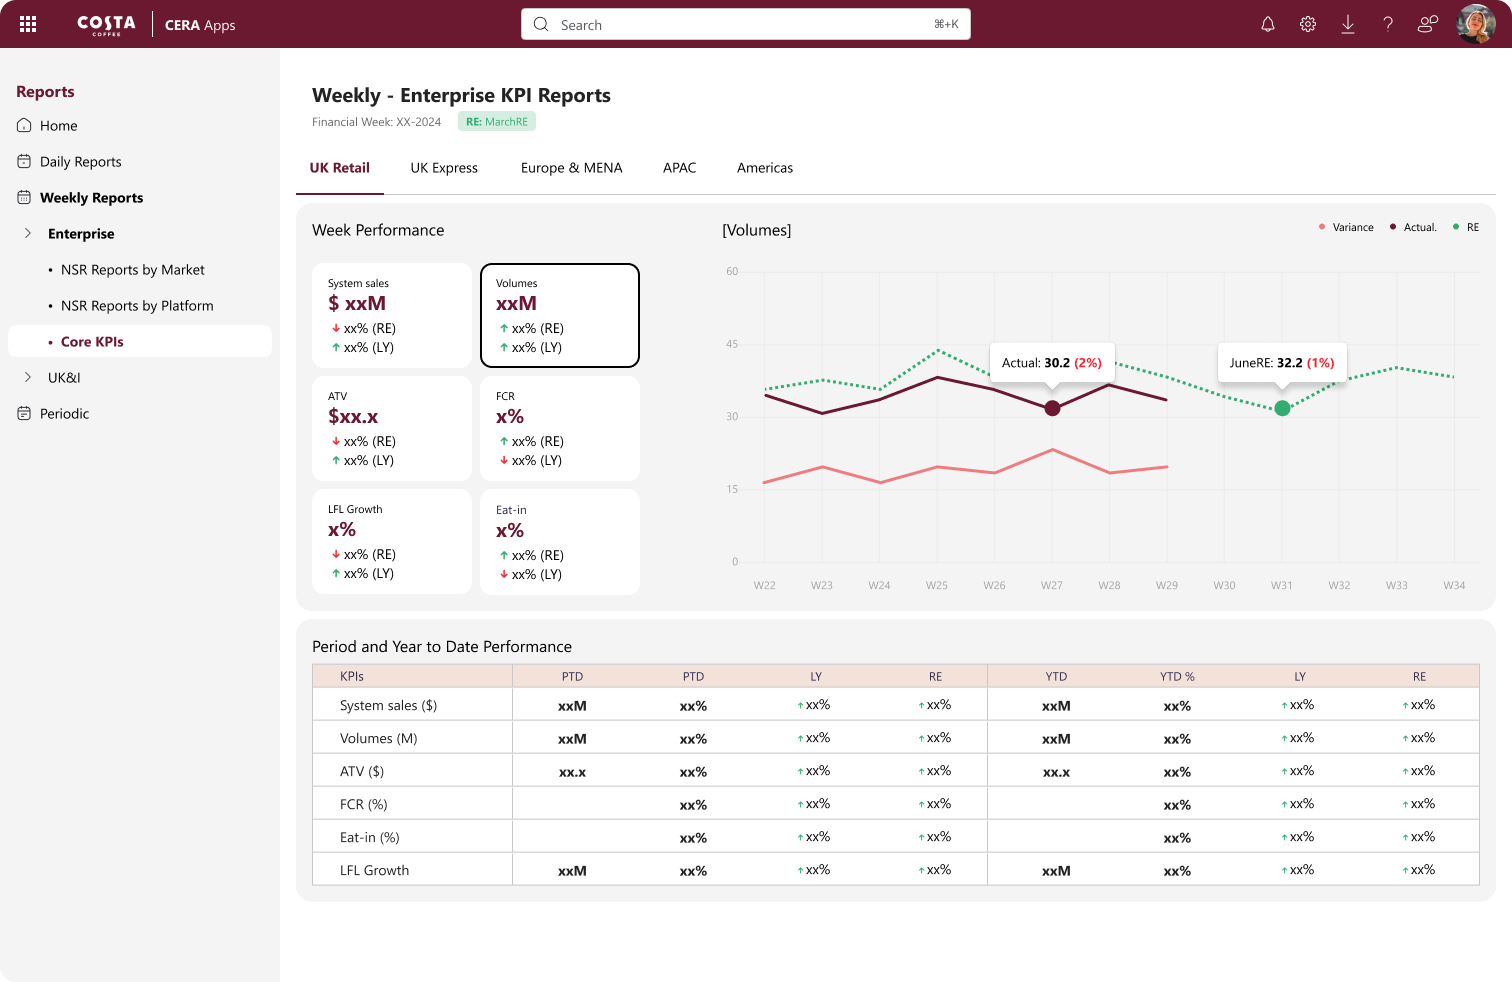
Report Rationalisation
- Grouped reports into 12 core themes aligned to business functions
- Identified 30% redundant reports
- Created a prioritisation matrix for stakeholders to vote on report usefulness
- Delivered a rationalised library with improved naming conventions, metadata, and filters
- Grouped reports into 12 core themes aligned to business functions
- Identified 30% redundant reports
- Created a prioritisation matrix for stakeholders to vote on report usefulness
- Delivered a rationalised library with improved naming conventions, metadata, and filters
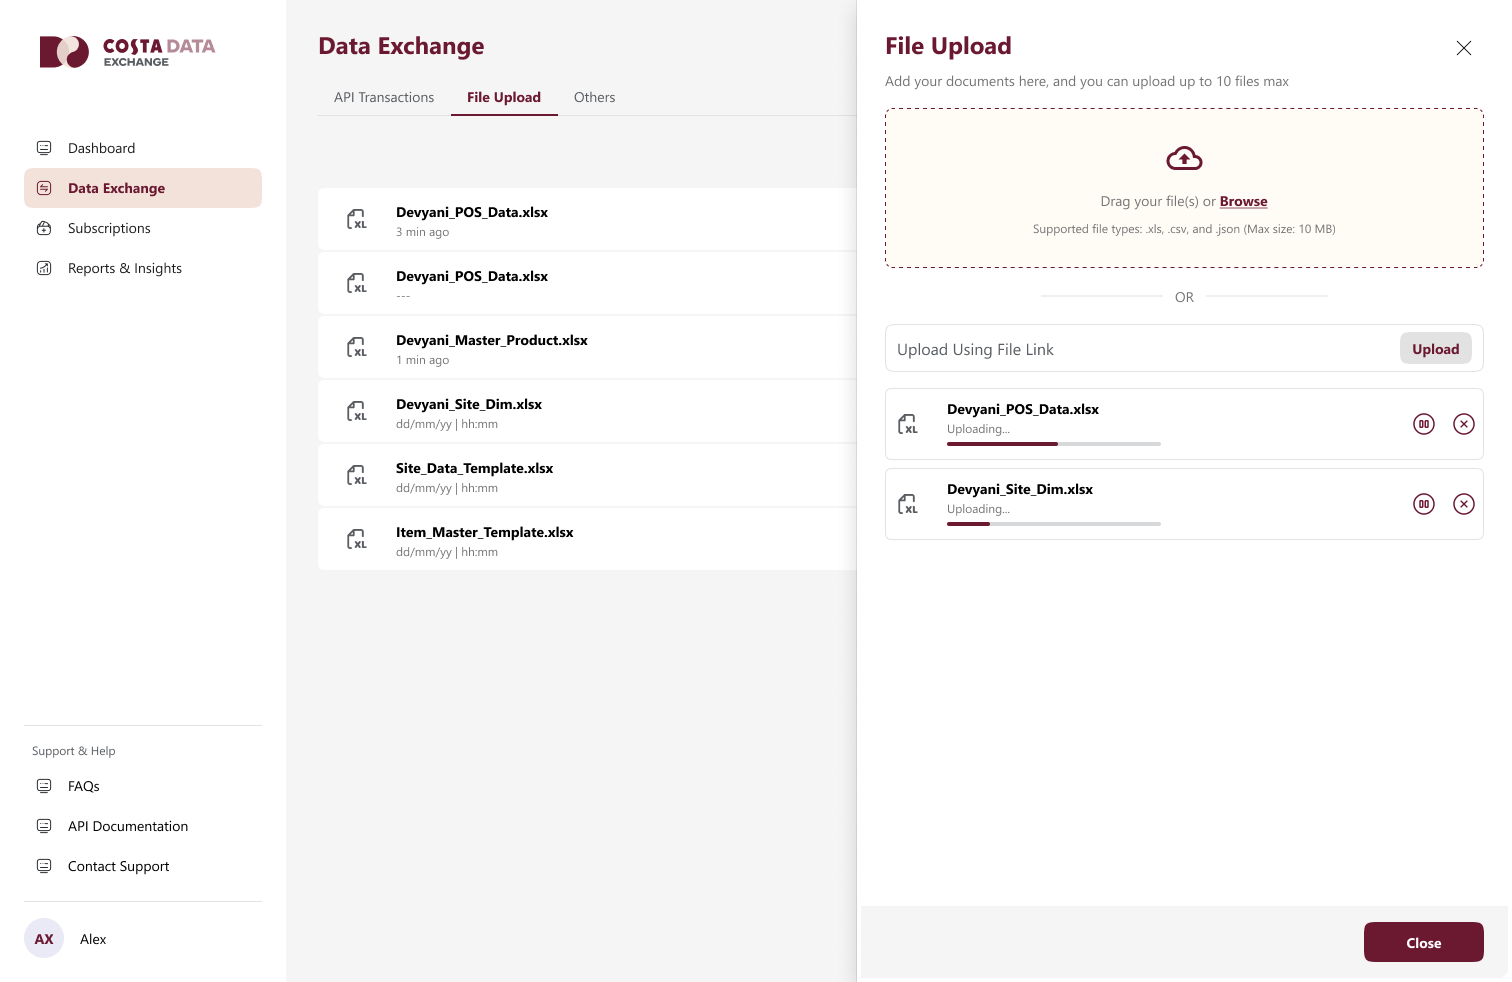
Costa Data Exchange MVP
Designed the portal to allow:
- Downloading pre-formatted Excel templates (POS, site data, master product codes)
- Downloading pre-formatted Excel templates (POS, site data, master product codes)
Uploading validated files with real-time error detection
- Dashboard view to track data status, errors, and revisions
- Implemented data validation logic to reduce manual QA
Integrated role-based access and audit logging for transparency
UX/UI
Design Process
Design Process
Wireframing & Flows:
Task-based journey flows for different personas
Clean wireframes with clear CTAs, drag-and-drop file upload, and tooltips
UI Design:
Designed using Costa’s brand palette and visual identity
Modular UI for easy scaling in the MyCosta portal
Usability Testing:
Conducted 3 rounds of remote usability tests with 10 users
Refined language, button placements, and onboarding instructions
Outcome &
Impact
Impact
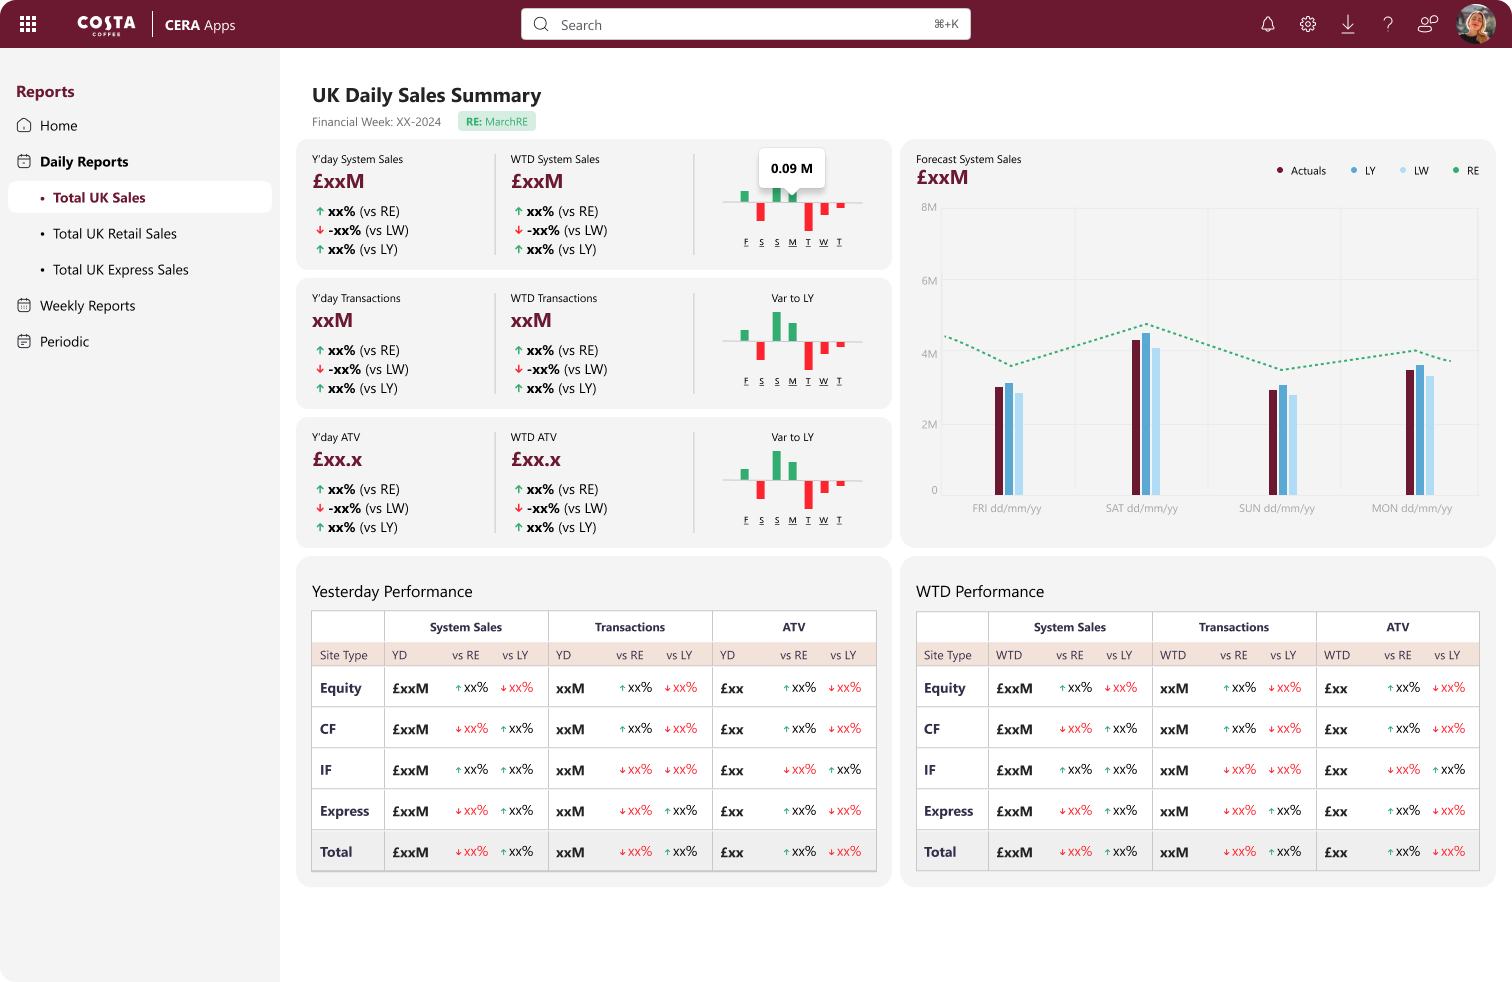
- Reduced report library from 120+ to 46 essential, curated reports
- Enabled franchisees to upload critical business data with 85% fewer errors
- Cut down data onboarding time by 40%
- Improved stakeholder confidence with better governance and transparency
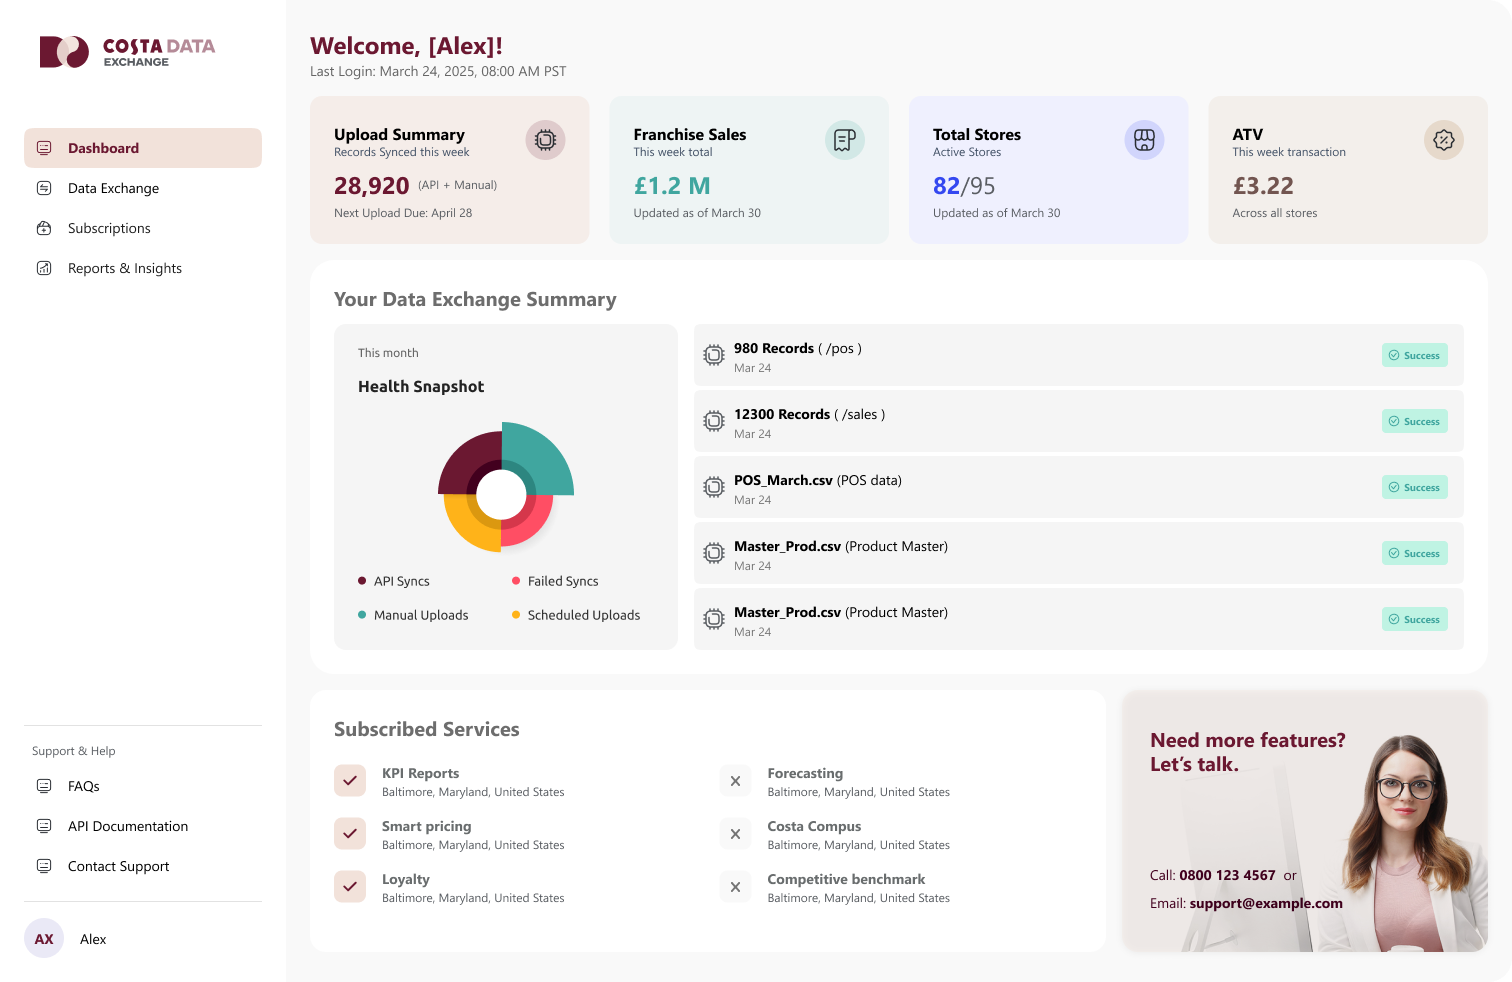
- Set the foundation for Costa’s centralised franchise management platform – MyCosta
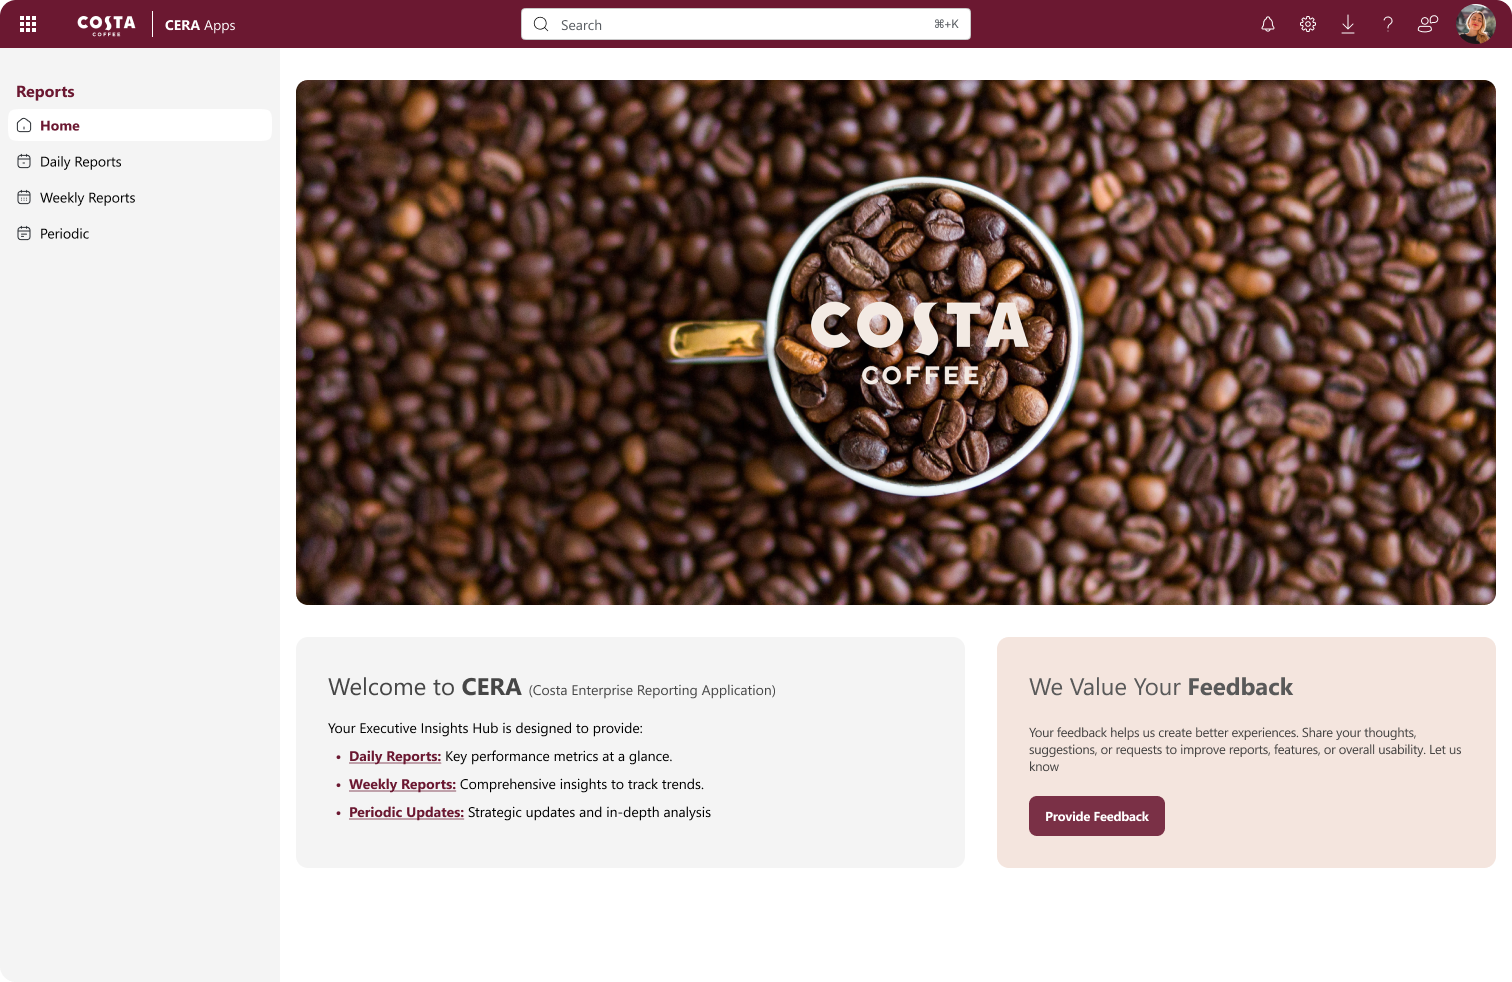
Costa Data Exchang Platform
Key Learnings
- Balancing flexibility for power users with simplicity for casual users was crucial
- Clear data templates and in-app validation drastically improved adoption
- Early involvement of data and business teams helped avoid design rework later
- Balancing flexibility for power users with simplicity for casual users was crucial
- Clear data templates and in-app validation drastically improved adoption
- Early involvement of data and business teams helped avoid design rework later